
Tree Search: Select desired injection brain compartment
Showing 0 matching cards

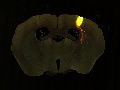
Region: Primary somatosensory area
Tracer: AAV2/1.CAG.tdTomato.WPRE.SV40
Coordinates: 2.75 mm; -0.96 mm; 1 mm
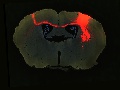
Region: Primary somatosensory area
Tracer: AAV2/1.CAG.tdTomato.WPRE.SV40
Coordinates: 2.5 mm; -0.48 mm; 1.25 mm
Region: Primary somatosensory area
Tracer: AAV2/1.CAG.tdTomato.WPRE.SV40
Coordinates: 2.5 mm; -0.48 mm; 1.25 mm